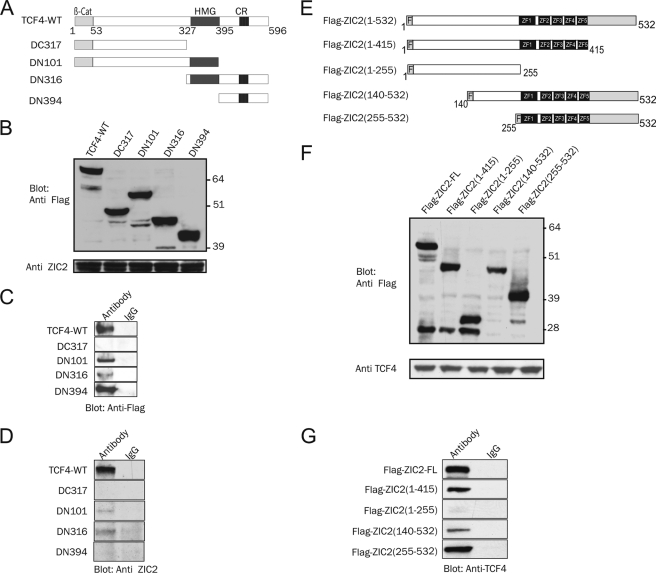
FIGURE 3.
Mapping the ZIC2·TCF4 interaction domains. A, schematic representation of the different TCF4 mutants. The HMG domain and C-terminal region (CR) are represented as dark gray boxes. The β-catenin-interacting domain (β-Cat) is represented as a light gray box. B, Western blot showing transient coexpression of FLAG-tagged TCF4, deletion mutants, and ZIC2 using the indicated antibodies. C, immunoprecipitated proteins using anti-ZIC2 antibody (or IgG as a mock) were subjected to Western blot analysis for FLAG detection. D, immunoblot of in vitro protein binding assay. FLAG-tagged TCF4 and its truncated forms were purified with anti-FLAG beads (with IgG serving as a mock) and incubated with in vitro translated ZIC2, and the precipitated complex was subsequently subjected to immunoblotting using antibody against ZIC2. E, schematic representation of ZIC2 and its deletion constructs. Zinc finger domains are represented as dark gray boxes. F indicates FLAG. F, Western blot showing the protein levels of overexpressed full-length ZIC2, ZIC2 deletions, and TCF4 using the indicated antibodies. G, proteins immunoprecipitated from the lysates in F using anti-FLAG antibody (or IgG as a mock) were analyzed by Western blotting using anti-TCF4 antibody.

