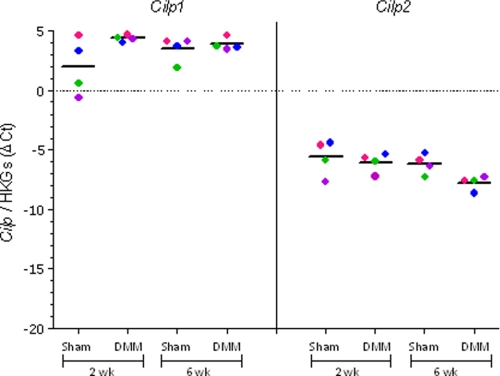
FIGURE 7.
Cilp1 and Cilp2 mRNA expression in a mouse model of osteoarthritis. qPCR of Cilp1 and Cilp2 expression in sham and DMM joints at 2 and 6 weeks postsurgery. The results of four mice at each time point are shown (average of three technical replicates) and the data from sham and DMM cartilage of each mouse are shown in corresponding colors. The results are shown as the ΔCT between Cilp1 and Cilp2 and the geometric mean expression of two housekeeping genes, Atp5b and Rpl10 (HKGs). The median result at each time point is indicated by a horizontal line.

