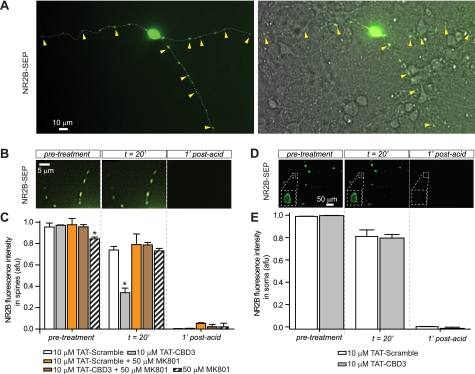
FIGURE 8.
TAT-CBD3 induces activity-dependent down-regulation of NR2B surface expression in dendritic spines. Representative deconvolved fluorescent images of surface-expressed NR2B-SEP on dendritic spines (A and B) or soma (D) of transfected neurons before, 20 min after application of TAT-Control, and 1 min after application of a short acid pulse (pH 5.0). A differential interference contrast image overlaid with a fluorescent image illustrating dendritic spines rich in NR2B (yellow arrowheads) is shown in A (right). Shown are average NR2B-SEP fluorescence intensities in spines (C) or soma (E) in the presence of MK801 alone or peptides alone or in the presence of peptides and MK801 at the times indicated. Each condition represents 37–70 spines from three experiments or 32–34 soma. *, significant difference compared with time-matched TAT-Control (p < 0.05; ANOVA for spines and Student's t test for soma). The ordinate represents average intensity in arbitrary fluorescent units (afu). Scale bars are as indicated. Error bars, S.E.

