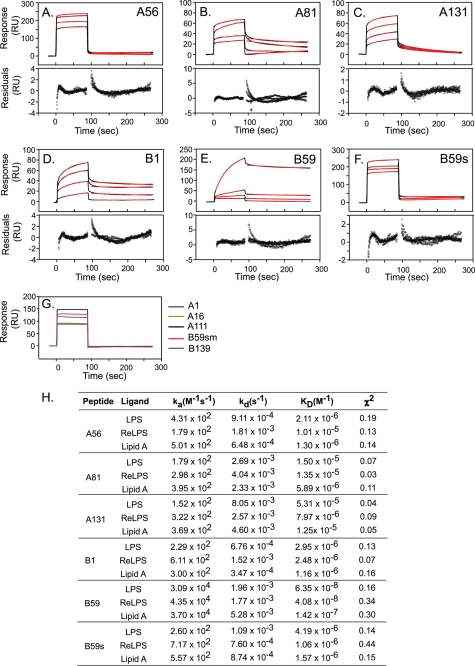
FIGURE 5.
Surface plasmon resonance measurements of the interaction of Hb peptides with LPS. Peptides in HBS were injected over the immobilized ligands at a flow rate of 30 μl/min. Sample concentrations were 50, 100, 150, and 200 μm (except for B59, for which the concentrations were 0.01, 0.05, 0.1, and 0.5 μm). The association and dissociation phases of data were separately fitted to a 1:1 Langmuir binding model in the BIAevaluation software (version 4.1). A–F, sensorgrams for the interaction of the peptides with LPS are shown in black. The red lines represent the corresponding fits. Plots of residuals corresponding to the differences between the experimental and best-fit curves are shown in the lower panel. RU, response units. G, representative sensorgrams of the peptides that did not bind LPS at a concentration of 200 μm: A1 (brown), A16 (green), A111 (black), B59sm (red), and B139 (purple). The response indicates a bulk shift without any binding activity. H, kinetic parameters for interaction of peptides with the various ligands.

