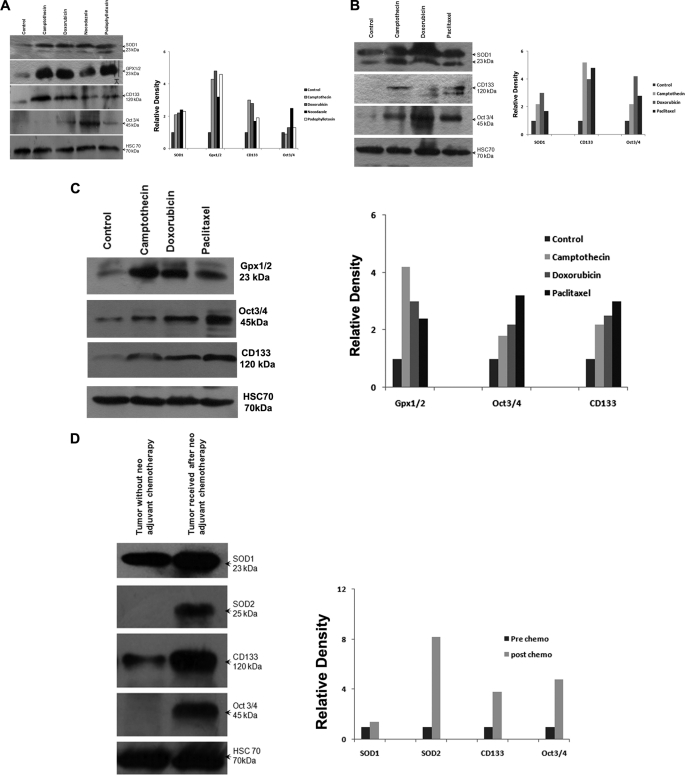
FIGURE 5.
Analysis of Oct-4 and antioxidant enzymes in drug-selected cells and primary tumors. A, Western blot analysis of total SOD1, glutathione peroxidase, CD133, and Oct-4 levels from whole cell lysates of MCF-7 control and MCF-7 drug-selected cells (50 μg of protein/lane). Hsc70 served as loading control. Densitometry measurements of bands were quantitated using ImageJ software and shown as a graph. B, Western blot analysis of total SOD1, CD133, and Oct-4 levels from whole cell lysates of MDA MB231 control and MDA MB231 drug-selected cells (50 μg of protein/lane). Hsc70 was used as loading control. Densitometry measurements of bands were quantitated using ImageJ software and shown as a graph. C, Western blot analysis of total glutathione peroxidase, Oct-4, and CD133 levels from whole cell lysates of T47D control and T47D drug-selected cells (50 μg of protein/lane). Hsc70 was used as loading control. Densitometry measurements of bands were quantitated and are shown as relative density. D, Western blots of tissue extracts from primary breast tumors probed for SOD1, SOD2, CD133, and Oct-4 (50 μg of protein/lane). Hsc70 was used as loading control. Relative density of the bands analyzed by ImageJ software is shown as a graph.

