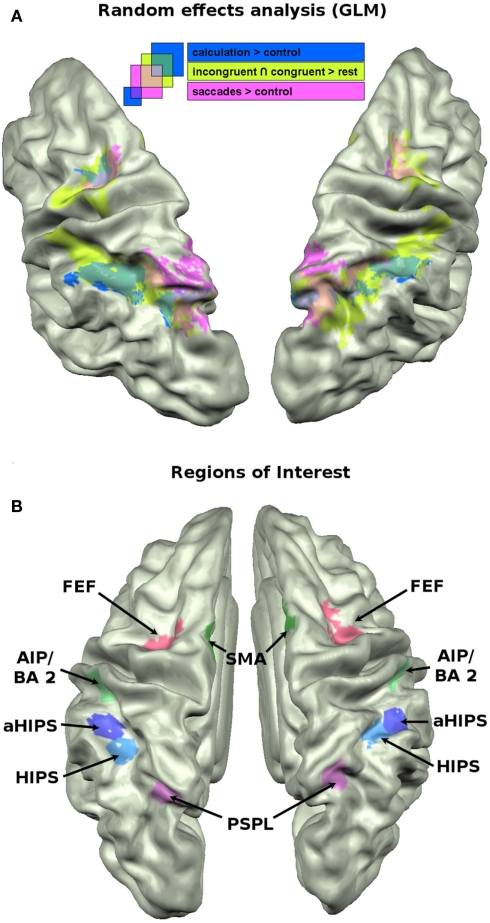
Figure 2.
(A) Brain activation data of the GLM analysis (p = 0.005) projected on the cortex based aligned average anatomy of the sample. Mapped contrasts: conjunction of incongruent and congruent vs. baseline (green); subtraction vs. control (blue); saccades vs. control (pink). (B) The 12 ROIs that were used for across voxel correlations, MVPA, and cluster analyses.

