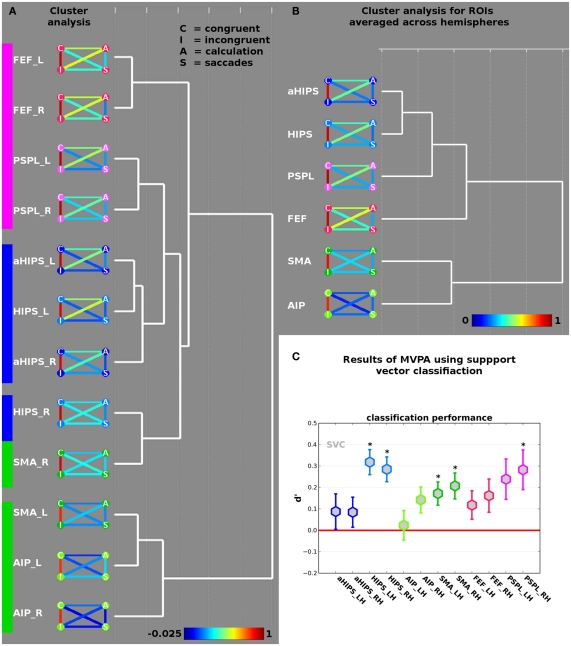
Figure 3.
(A) Results of the cluster analysis of the across-voxel correlations between congruent and incongruent contrasts, and the two localizer tasks (saccades and calculation) in the 12 ROIs (see Figure 2B). The nodes of the AVC matrices represent congruent (“C”), incongruent (“I”), calculation (“A”) and saccades (“S”) contrasts. The color of the connecting lines between the disks indicates the height of the respective correlation in the ROI (see bottom for scale). (B) Results of the cluster analysis of the 12 ROIs collapsed across hemispheres. (C) Results of the decoding analysis differentiating incongruent from congruent trials in the different ROIs. Coefficient d-prime was computed by defining correct classification of congruent trials as congruent as “hit” (true positive) and classification of incongruent trials as incongruent as “correct rejection” (true negative). Stars indicate d-prime significantly larger than zero (red line) at p < 0.05 (corrected for multiple comparisons). Error bars represent SE of the mean.

