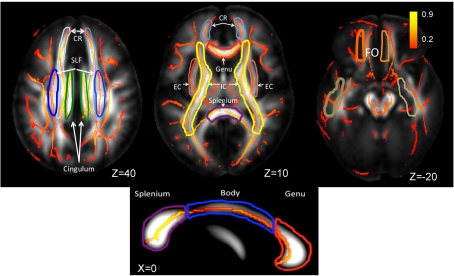
Figure 2.
Skeletonized, average FA values are shown on the population average FA image. WM-tract labels for nine major tracts are taken from the Johns Hopkins DTI WM atlas. The average FA values were calculated for the following tracts: CR, corona radiata; SLF, superior longitudinal fasciculus, cingulate; EC, external capsule; IC, internal capsule, FO, fronto-occipital and the genu, body, and splenium of corpus callosum. The population-wise average FA values are color coded on the skeleton of the tract. The location of the axial slices (the Z-coordinate) is provided in the Talairach reference frame. The three segment of corpus callosum are shown on the mid-sagittal slice (Talairach X = 0).

