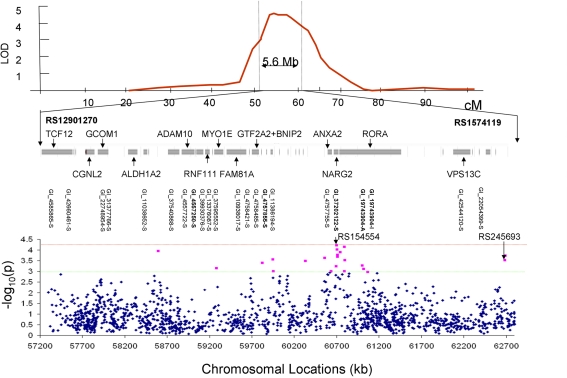
Figure 4.
The LOD peak was flanked by markers rs12901270 and rs1574119 and covered 5.6 Mb of genome (top). The chromosomal region under the linkage peak harbored 20 genes with 22 gene expression measurements (middle). Results (-log10 of the p-value) of the association analysis for 1565 SNPs located under the linkage peak are plotted along the x-axis (bottom). The red line corresponds to the significant evidence value of p = 5·10−5. The green line corresponds to the suggestive evidence value of p = 1·10−3.

