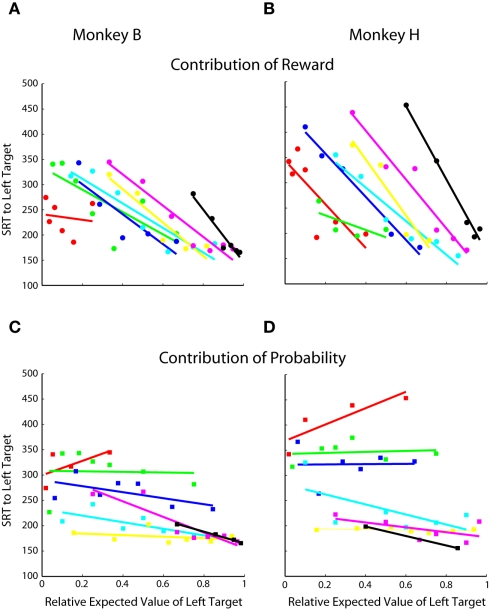
Figure 5.
Contribution of reward magnitude and probability to SRT. Each point represents 150–225 trials of a specific prospect collapsed across two to three blocks of trials. Same single-target data as Figures 4C,D. (A,B) Contribution of reward magnitude. Each color indicates a group of prospects with the same probability. Within each color, each point represents a different reward magnitude condition. In order, red was the lowest probability, followed by green, blue, cyan, yellow, magenta, and black was the highest. See Table 1 for exact values. (C,D) Contribution of reward probability. Each color indicates a group of prospects with the same reward magnitude and each point within the colored groups represents a different reward probability.

