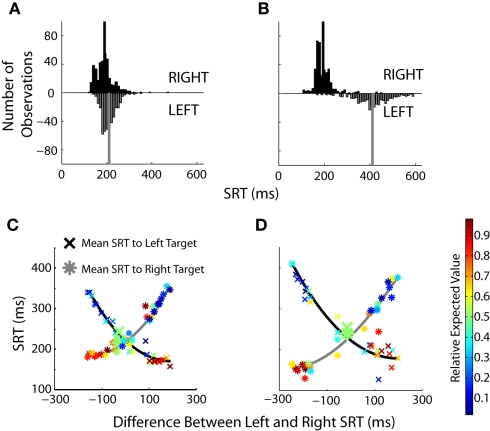
Figure 6.
The influence of value on SRT distributions. (A,B) Histograms for equal value (50% left probability/50% left reward magnitude) and skewed value (10% left probability/38% left reward magnitude) blocks of trials. Black bars represent SRTs to the right target, gray bars represent SRTs to the left target. The mean of each distribution is indicated by the solid vertical lines. (C,D) Same single-target data set as Figures 4C,D. Each data point represents one of the 49 different prospects, composed of 150–225 individual trials collapsed over two to three blocks of the same prospect. Blocks are not sorted on value, but on the difference in SRTs between the left and right targets. Enlarged points are blocks in which the value was equal to the left and right targets. The relative expected value of each point is indicated by the heat map legend on the right.

