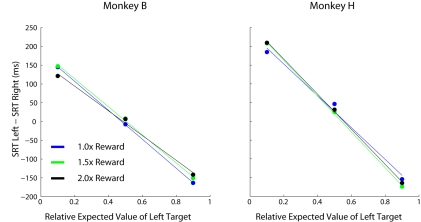
Figure 9.
Comparative effects of relative and absolute expected value on SRT. Each data point represents 200–300 individual trials of a separate task comprised of 100% single-target trials. Three conditions were performed that had the same relative expected values (indicated by the bold cells in Table 1), however, all reward magnitudes were increased by the stated multiples between conditions (i.e., different absolute expected value at each location).

