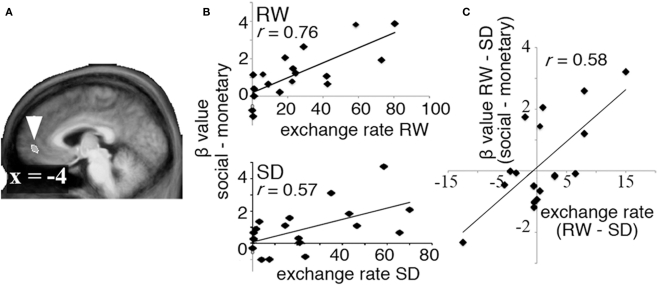
Figure 3.
Decision value signals. To identify regions carrying decision value signals in both RW and SD, we computed the correlation between exchange rate in each state and the difference in BOLD signal associated with receipt of social and monetary rewards (the “decision value” signal). (A) A region in VMPFC showed a significant correlation between exchange rate and difference between activation in response to social and monetary rewards in both RW and SD. (B) Correlation between exchange rate and decision value signals in VMPFC in RW (top) and SD (bottom). (C) Change in decision value signals across states (RW–SD, y axis) correlated significantly with change in exchange rate (RW–SD, x axis).

