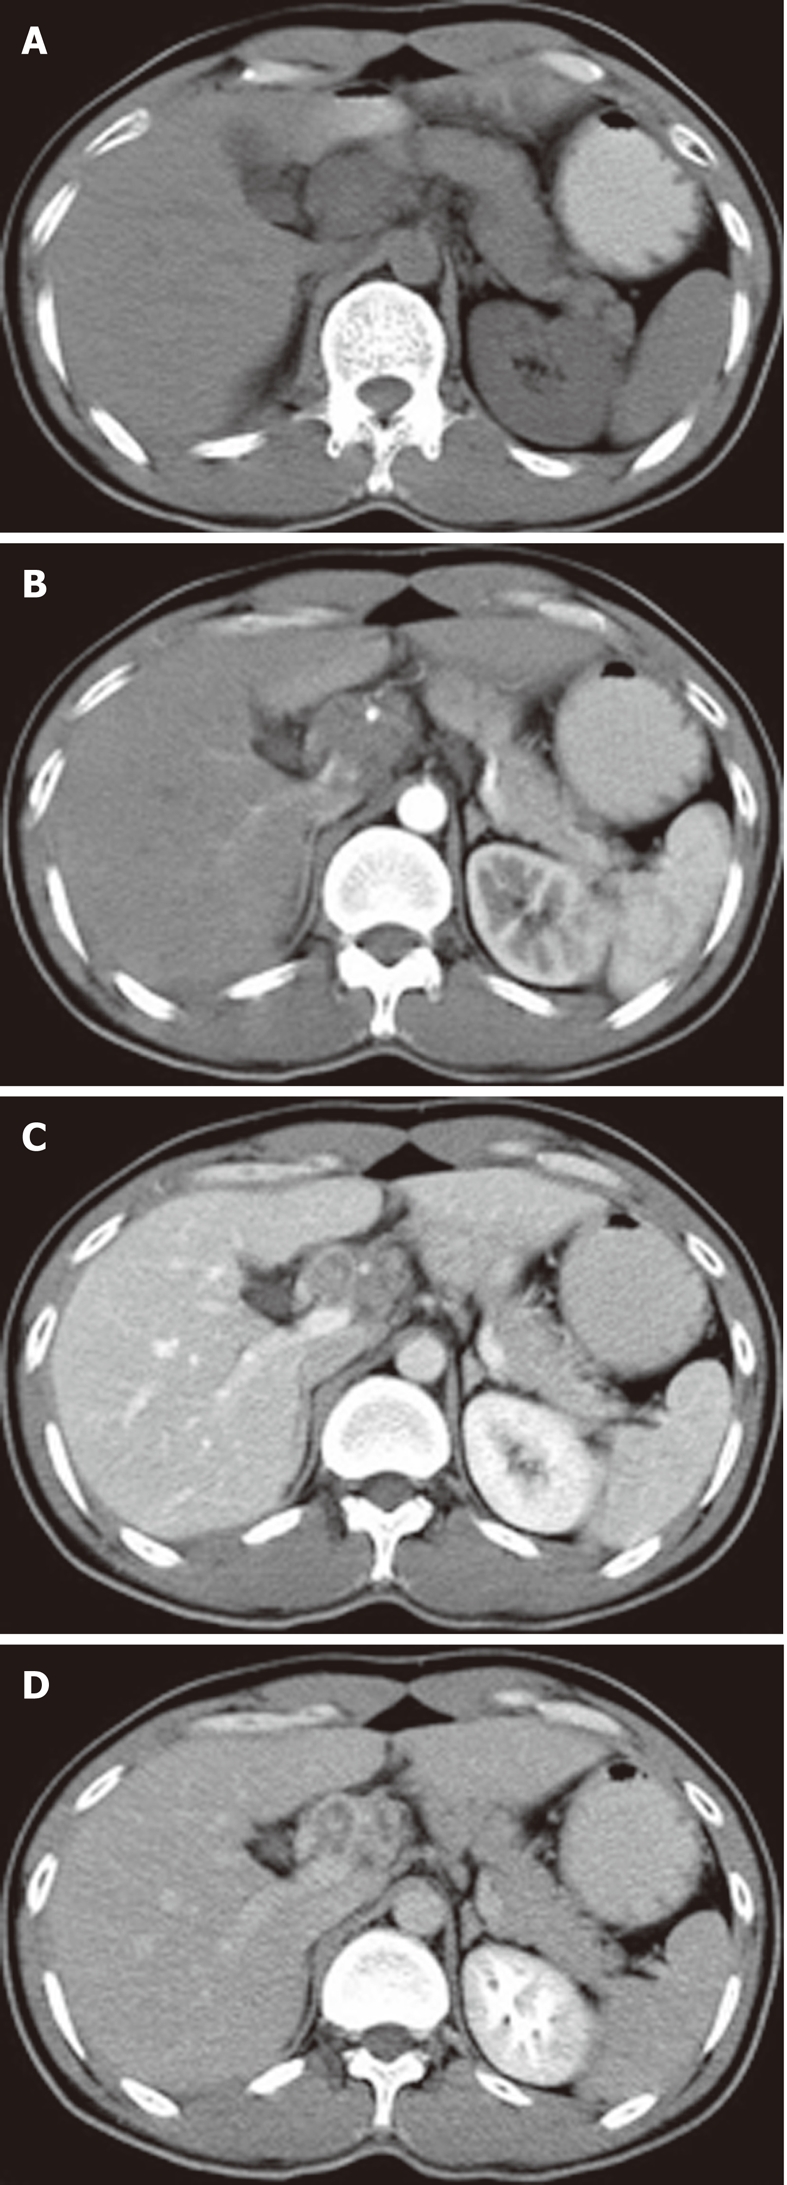
Figure 3.

Periportal tuberculous lymphadenopathy. A: Plain computed tomography scan showing hypodense masses in the hepatic portal region; B-D: After injection of contrast material, continuing peripheral enhancement allows individual lymph nodes to be defined, and the common hepatic artery was embedded within the lesion without definite evidence of stenosis.
