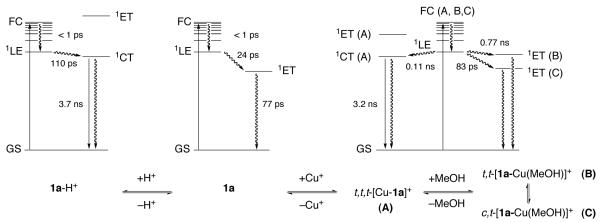
Figure 9.
Jablonski diagram for the excited state deactivation pathways of probe 1a in neutral methanol (center), under acidic conditions (left), and in the presence of [Cu(I)(CH3CN)4]PF6 (right). The indicated lifetime data are based on the pump probe experiments (GS = ground state, FC = Franck-Condon excited state, 1LE = local excited state, 1ET = electron transfer state, 1CT = emissive charge transfer excited state.

