
Figure 3.
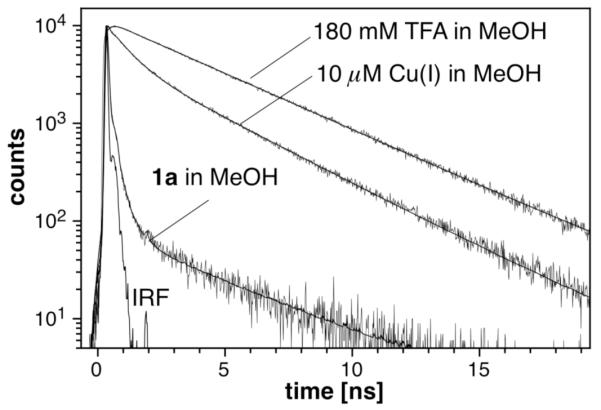
Time-dependent fluorescence decay profile of 1a in methanol, and in the presence of 10 μM [Cu(I)(CH3CN)4]PF6, or 180 mM trifluoroacetic acid (TFA). A 1 μM solution of 1a was excited at 372 nm (80 ps FWHM) and the emission signal was detected by single photon counting at 480 nm. Non-linear least squares fitted profiles are shown as solid lines (see Table 2 for fitting data; IRF = instrument response function).