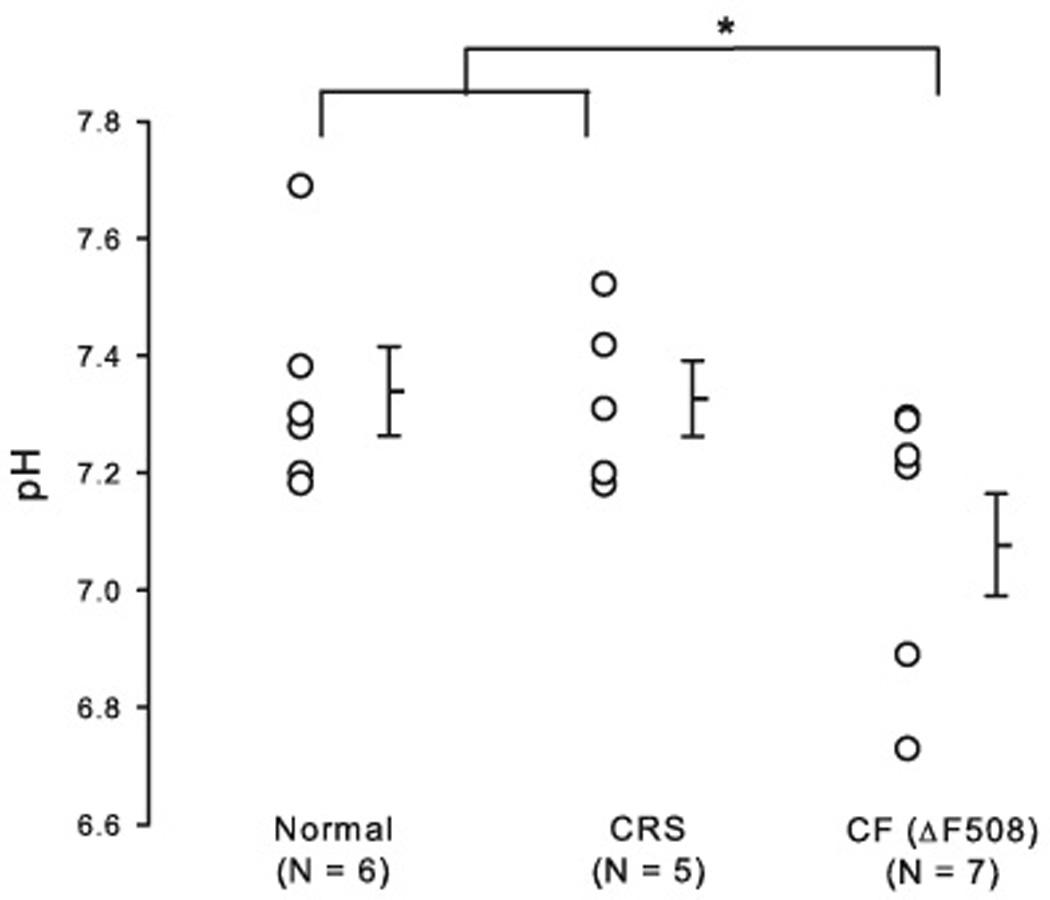
Figure 1. Distribution of equilibrium pH of freshly excised sinonasal epithelia.

Individual equilibrium pH values are plotted and average values are shown as horizontal bars. Nasal epithelia from homozygous ΔF508 CF individual had significantly lower equilibrium pH (pH = 7.08 ± 0.09), compared to nasal epithelia from normal and CRS without asthma (p = 0.041). N refers to the number of tissue from different individuals. Error bars represent SEM (standard error of the mean); * denotes a significant difference (p < 0.05).
