Figure 5.
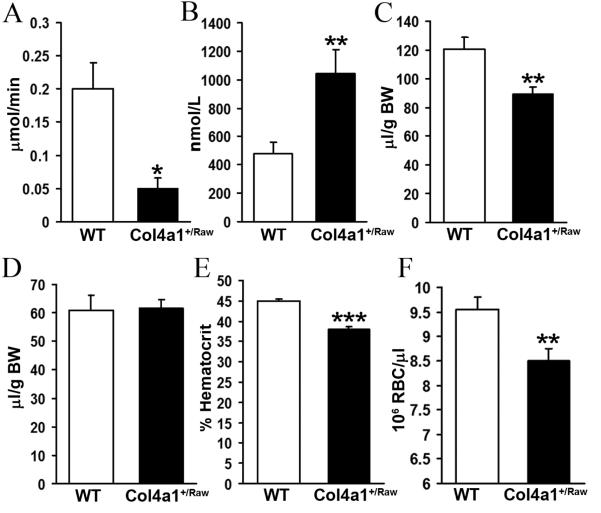
Low blood pressure is associated with reduced blood volume. (A) Sodium excretion in 40 day old animals (Col4a1+/Raw 0.05 μmol/min (n=5), WT 0.2 μmol/min (n=7), p<0.05 t-test) (B) Plasma aldosterone levels in 40 days old animals. (Col4a1+/Raw 1044 nmol/L (n=5), WT 476 nmol/L (n=7), p<0.01 t-test) (C) Blood volume in animals (Col4a1+/Raw 88.9 μl/g body weight (n=10), WT 120 μl/g body weight (n=13), p<0.01 t-test). (D) Plasma volume of animals. (E) Reduced hematocrit in mutant animals (Col4a1+/Raw 38% (n=15), WT 45% (n=19), p<0.001 t-test). (F) Reduced red blood cell number in Col4a1+/Raw animals. (Col4a1+/Raw 8.55 × 10⁶ RBC/μl (n=10), WT 9.50 × 10⁶ RBC/μl (n=12), p<0.01 t-test). Error bars indicate standard error of measurement. * p< 0.05, ** p< 0.01, *** p<0.001 t- test

