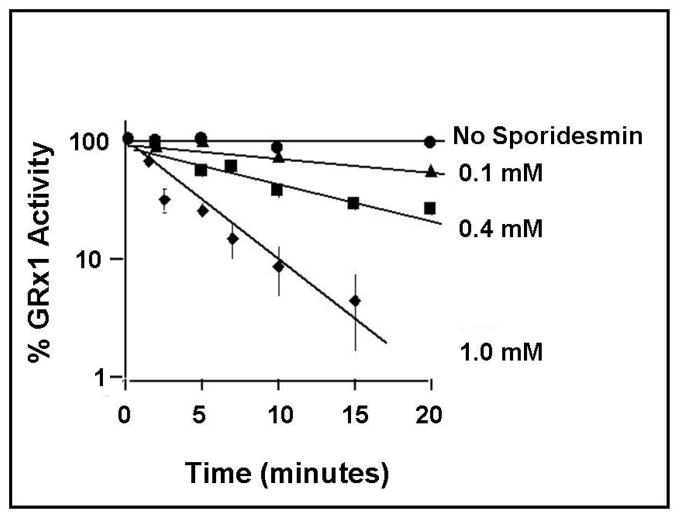
Figure 2. Inactivation of GRx1. Time and concentration dependent loss of GRx1 activity.
GRx1 (2-10 μM) was treated with different concentrations (0.1–1 mM) of sporidesmin in 0.1 M K phosphate, pH 7.5, 10 % ethanol. At different times, aliquots were tested for GRx1 activity according to the spectrophotometric assay (GSSG-reductase mediated NADPH oxidation coupled to GSSG formation) using cys-SSG as the prototype substrate. Rates of GSSG formation were also determined with sporidesmin as the disulfide substrate and are designated as non-cys-SSG rates. Since residual sporidesmin is transferred to the assay with the deactivated GRx1, non-cys-SSG rates were subtracted from cys-SSG rates for each time point. Each point represents the mean value, plus and minus the standard error, for at least three determinations. Where error bars are not evident they are within the size of the symbol.

