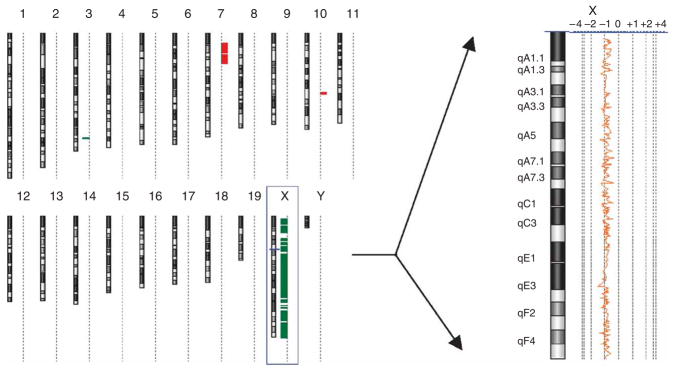
Figure 7.
A single sex chromosome in an F1 hybrid embryo from a Dnmt3l+/− sire. Array CGH analysis of a mouse with paternal X chromosome only (see Table 1). The genome view (left) and expanded X chromosome view (right) were created using Agilent CGH analytics software. The genome view shows an ideogram of each mouse chromosome, with a dotted vertical line beside each ideogram. Horizontal bars that extend to the right and left of this dotted line indicate gain and loss calls, respectively, by the software. The chromosome view shows a moving average plot with a 0.5-Mb window. In this mouse, the moving average is shifted from 0 to −1 along the entire X chromosome, indicating a single X chromosome.

