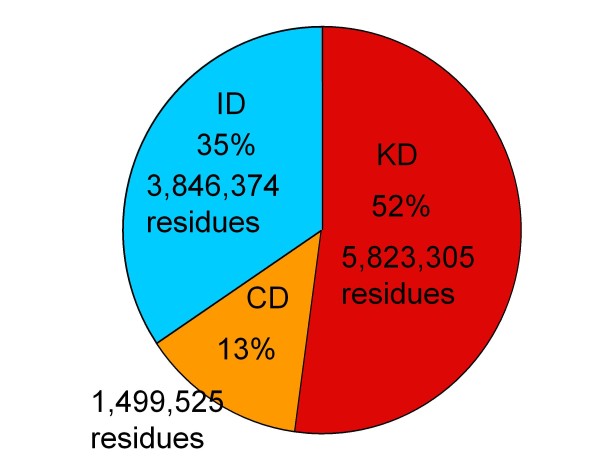
Figure 1.
Fractions of KDs, CDs, and ID regions in the human proteome. The DICHOT system was applied to all human proteins in the Swiss-Prot database. The red, orange and blue regions represent SDs of known structure (KDs), cryptic SDs (CDs), and ID regions, respectively. The fraction and the number of total residues in each section are shown.

