
Figure 3.
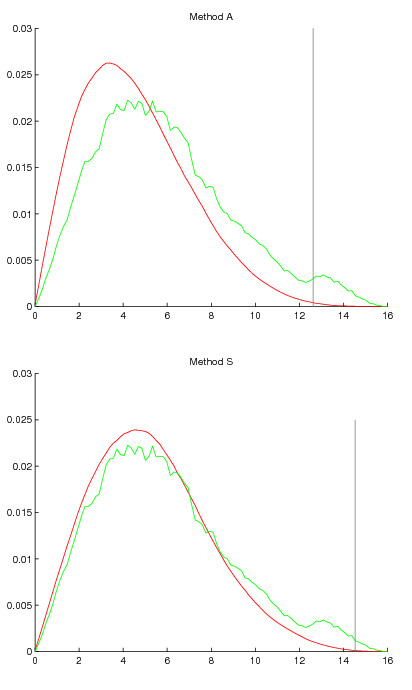
Null distribution of periodicity scores produced by methods A and S in dataset Cdc15 plotted together with the distribution of values in the data. Green density function shows the distribution in data and red density function shows the null distribution produced by the randomization method. The gray vertical line shows threshold of significance as decided by the Benjamini-Hochberg method at FDR 0.05.