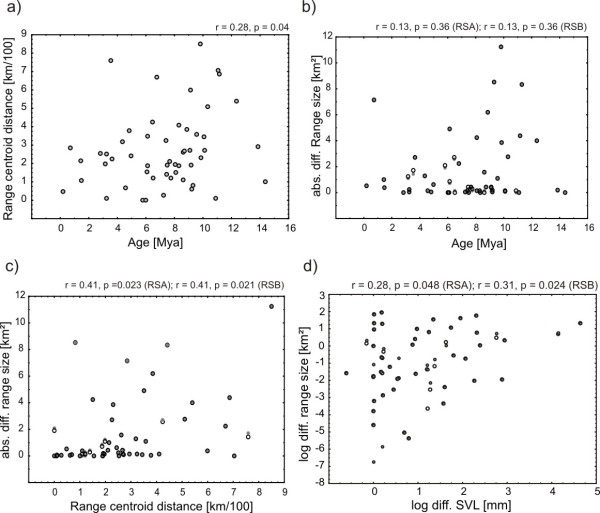
Figure 3.
Relationships between range size, range centroid distance, age and body size in mantellid frogs. Scatterplots of range and body size correlations for sister species contrasts. Because we used two different range size estimates, we overlaid the plots for these (RSA and RSB). RSA is shown as large open dots and RSB is shown as small filled dots. Datapoints congruent among the two estimates are consequently depicted as large filled dots. a - Range centroid distance increases with age of ss pair. b- Absolute differences in range size increase with age of ss pair. c - range centroid distance increases with range size contrast in sister species. d- log range size tip contrasts of mantellid sister species are correlated with log body size tip contrasts.

