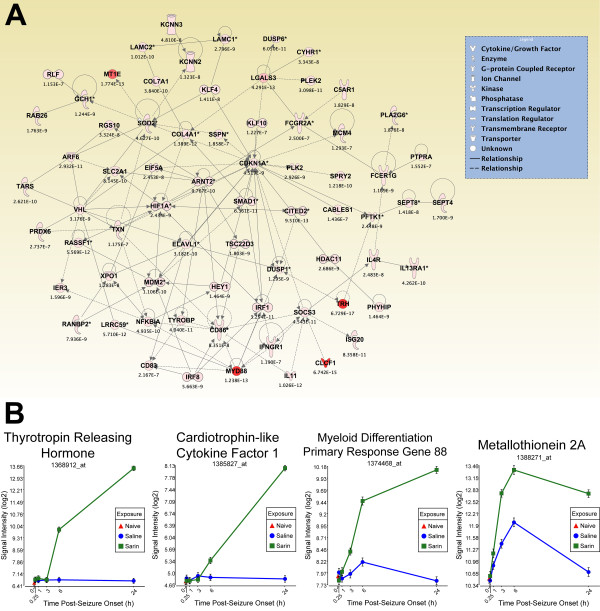
Figure 11.
Seizure-induced alteration of cellular growth and proliferation, cellular development, and lipid metabolism gene network. As detailed in Figure 5, a two-way ANOVA was performed to identify genes most significantly changed based on exposure and time after seizure onset. Genes meeting a p-value cutoff of 3.046 × 10⁻⁷ were overlaid onto a global molecular network developed from information within the IPA Knowledge Base, and the networks were then algorithmically generated based on their connectivity. (A) Graphical representation of the network reveals significant changes in gene expression due to sarin-induced seizure. Genes are represented as nodes of various shapes to represent the functional class of the gene product, and the biological relationship between two nodes is represented as a line. The intensity of the node color indicates the degree of differential expression. (B) Top four genes within network significantly altered by sarin-induced seizure. The expression levels of thyrotropin releasing hormone (TRH), cardiotrophin-like cytokine factor 1 (CLCF1), and myeloid differentiation primary response gene 88 (MYD88) increased during the time period examined with peak expression at 24 h after seizure onset. Metallothionein 2A (labeled MT1E in IPA network) expression peaked at 6 h after seizure onset and dropped at 24 h in both the control and sarin-exposed animals.

