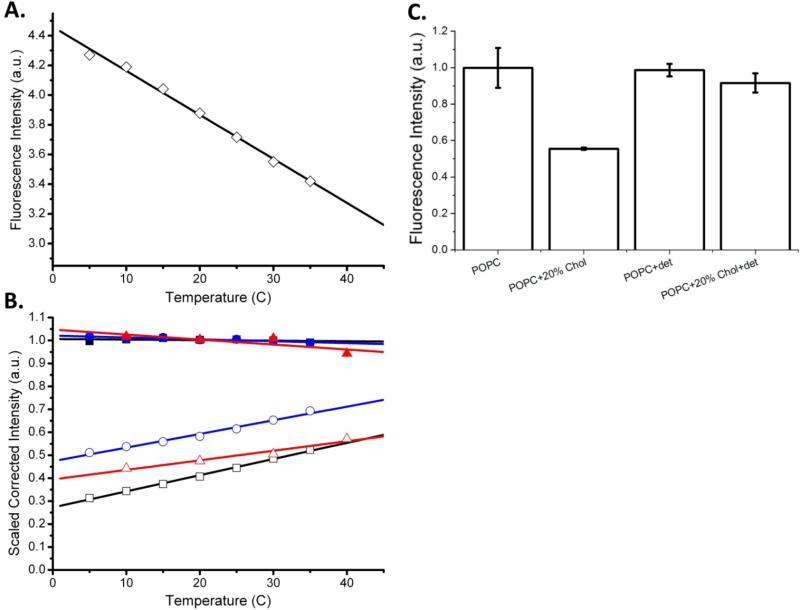
Figure 6.
The clustering of syntaxin-1A in cholesterol-containing lipid model membranes decreases with increasing temperature as revealed by relief of self-quenching of fluorescently labeled syntaxin. A. Fluorescence intensities of 1 μM Alexa 647-labeled syntaxin in 2% v/v Triton X-100 as a function of temperature. B. Scaled fluorescence intensities of labeled syntaxin reconstituted into either POPC (closed symbols) or POPC:Chol (open symbols) bilayers at protein-to-lipid ratios of 1:1000. Three representative experiments are shown for each lipid composition. The data are normalized with the values in POPC bilayers at 20 °C set to one and corrected with the fluorophor temperature coefficient determined from graph A as described in the text. C. Mean scaled fluorescence intensities of labeled syntaxin in different environments from three or more experiments as indicated. 2% v/v Triton X-100 was added to the samples labeled with “det”.

