Figure 2.
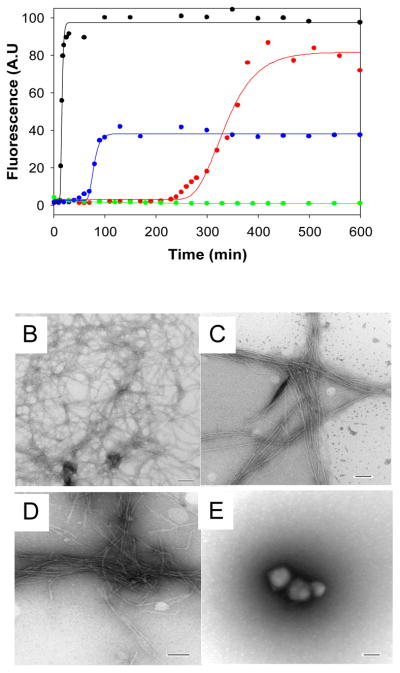
Synergistic inhibition of amyloid formation by IAPP. (A) The results of fluorescent detected thioflavin-T binding assays are displayed. Black, wild type IAPP; Red, a 1:1 mixture of wild type IAPP with G24P-IAPP; Blue, a 1:1 mixture of wild type IAPP with I26P-IAPP; Green, a 1:0.5:0.5 mixture of wild type IAPP with G24P-IAPP and I26P-IAPP. (B) TEM image of wild type IAPP alone. (C) TEM image of a 1:1 mixture of wild type IAPP and G24P-IAPP. (D) TEM image of a 1:1 mixture of wild type IAPP and IAPP-I26P. (E) TEM image of a 1:0.5:0.5 mixture of wild type IAPP, G24P-IAPP and I26P-IAPP. Scale bars represent 100 nm. Aliquots were removed from the kinetic experiments 600 minutes after amyloid formation was initiated and TEM images collected. The kinetic assays depicted in panel (A) were carried out in 20 mM Tris-HCl (pH 7.4), 2% HFIP (v/v) with continuous stirring at 25°C. The total concentration of inhibitor was the same in the 1:1 mixtures and in the 1:0.5:0.5 mixtures and was equal to 16 μM. Wild type IAPP was at 16 μM.

