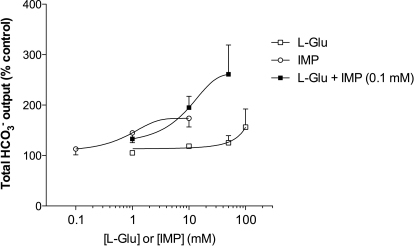
Fig. 2.
Dose response of HCO3− secretion to luminal perfusion of l-Glu and/or IMP in rat duodenum. Total HCO3− output (μmol/25 min/cm) during the challenge period in l-Glu, IMP, or l-Glu + IMP group was compared with Krebs alone perfusion group and expressed as percentage of control. Each data point represents mean ± S.E.M. (n = 2–6).

