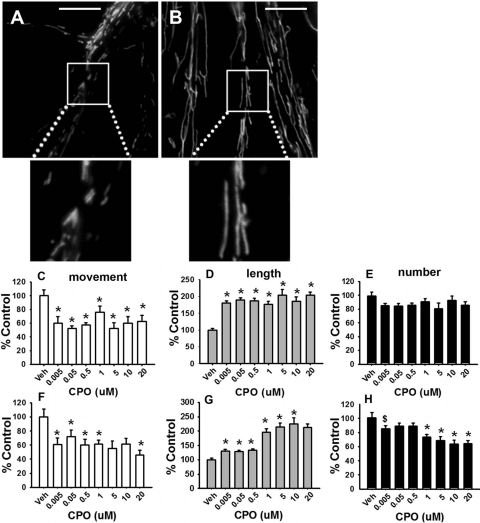
Fig. 2.
CPO disrupts mitochondrial transport and alters mitochondrial dynamics in cortical neurons. Representative images of cultures exposed to vehicle or 0.005 μM CPO for 24 h are provided in A and B, respectively. Scale bar, 100 μm. CPO exposure of 24 h was associated with a decrease in axonal transport (mean number of mitochondria moving per micrometer) (C), an increase in mitochondrial length (mean mitochondrial length within the region of interest) (D), and a nearly significant (dose effect p < 0.054) decrease in mitochondrial number (mean number of mitochondria per micrometer) (E). CPO exposure for 1 h was also associated with a decrease in mitochondrial movement (F), an increase in mitochondrial length (G); and a decrease in mitochondrial number (H). Data are presented as the percentage of control ± S.E.M. *, significantly different (p < 0.05) from control; $, p < 0.09.

