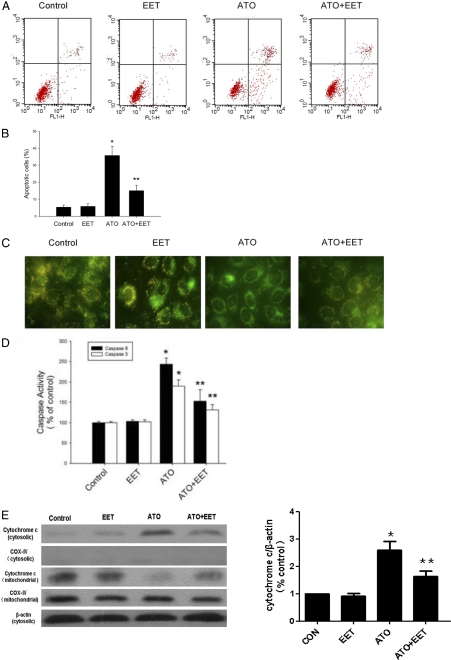
Fig. 3.
11,12-EET inhibition of ATO-induced mitochondrial impairment. A, flow cytometric analysis of Tca-8113 cells treated with ATO (10 μM) and 11,12-EET (100 nM) for 24 h by using Annexin V-FITC and PI staining. The lower left quadrants represent nonapoptotic cells; the upper left quadrants represent cells that have lost their cell membranes and are dead, either end-stage apoptotic or necrotic (Annexin V-negative, PI-positive); the lower right quadrants represent early apoptotic cells (Annexin V-positive, PI-negative); and the upper right quadrants represent late apoptotic or necrotic cells (Annexin V- and PI-positive). B, graph represents the mean percentage of Annexin V-positive Tca-8113 cells expressed as the proportion of positive cells in each group (n = 3). C, detection of the mitochondrial transmembrane potential collapse by JC-1 staining. In cells with normal mitochondrial function, membrane potential-driven accumulation of these dyes results in the formation of red fluorescent J-aggregates as shown in the control panel. In cells treated with ATO, the green mitochondria stained with JC-1 dye indicate depressed ΔΨm. D, caspase-3 and caspase-9 activities in Tca-8113 cells. Cells were treated with 10 μM ATO and 100 nM of 11,12-EET for 24 h, lysed, and analyzed spectrophotometrically for caspase activity. E, cytochrome c release in Tca-8113 cells. Cells were treated with 10 μM ATO and 100 nM of 11,12-EET for 24 h and lysed, and cytosolic protein were analyzed by Western blot. Data are reported as mean absorption relative to control ± S.E.M. (n = 5). *, p < 0.05 versus control; **, p < 0.05 versus ATO treatment alone.

