Fig. 6.
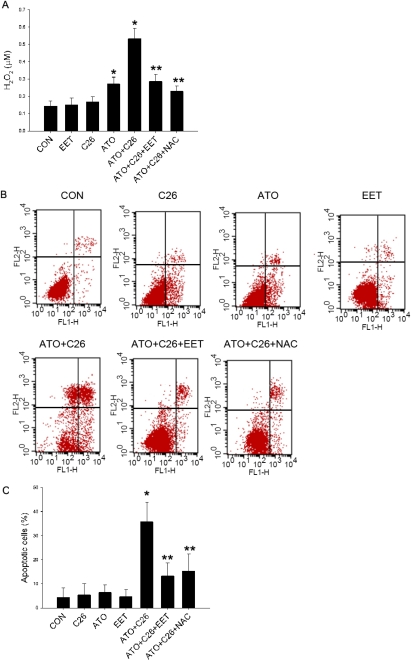
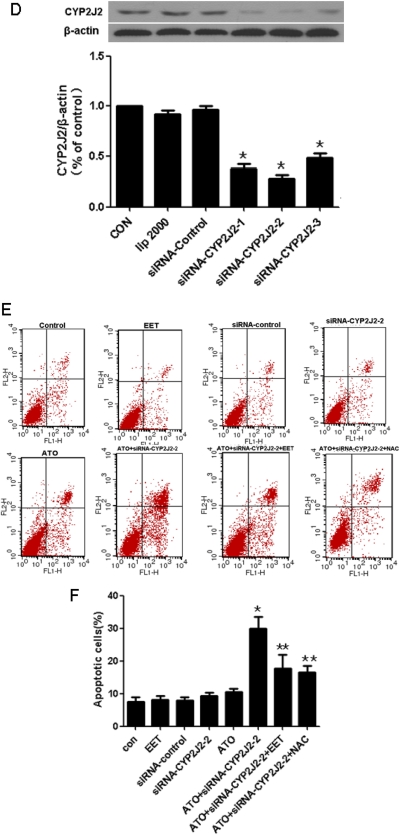
Effects of CYP2J2 inhibition on sensitization of tumor cells to ATO-induced ROS production and apoptosis. Tca-8113 cells were incubated with 2 μM ATO, 1 μM C26, 100 nM 11,12-EET, and/or 2 mM NAC. A, Tca-8113 cells were preincubated with C26 and NAC for 1 h, followed by 24-h incubation with 11,12-EET, and 2 h before detection, ATO was added to induce ROS. Production of hydrogen peroxide was measured by Amplex Red. Results shown are mean ± S.E.M. (n = 6). B, Tca-8113 cells were preincubated with C26 and NAC for 1 h, and then EET and ATO were added for 24 h. Density plots of Annexin V/PI staining were measured by flow cytometry. C, graph represents the mean number of Annexin V-positive Tca-8113 cells expressed as percentage of control untreated cells ± S.E.M. (n = 3). Each sample was run in duplicate, and the data are representative of three independent assays. D, Tca-8113 cells were treated with CYP2J2-specific siRNA (100 nM) for 24 h. CYP2J2 expression was determined by Western blot (n = 3). E, Tca-8113 cells were treated with CYP2J2-specific siRNA (100 nM), EET, and ATO for 24 h. Density plots of Annexin V/PI staining for apoptosis were measured by flow cytometry. F, graph represents the mean number of Annexin V-positive Tca-8113 cells expressed as percentage of control untreated cells ± S.E.M. Each sample was run in duplicate, and the data are representative of three independent assays. *, p < 0.05 versus control; **, p < 0.05 versus ATO+C26.


