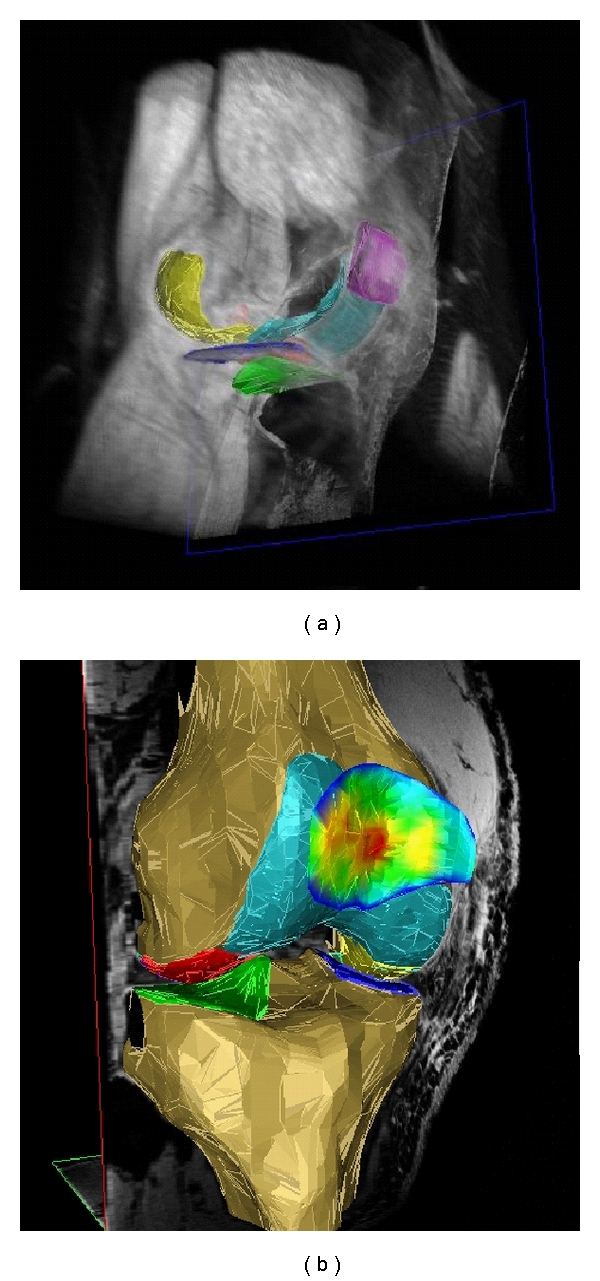
Figure 1.

3D reconstruction of the knee cartilages after segmentation: (a) View from anteromedial with softtissues in grey (b) View from anterior-lateral, with the bone segmented and with the cartilage thickness distribution in the patella displayed in false colors (red: thick cartilage; blue: thin cartilage). The cartilage of the medial tibia (MT) is depicted dark blue, that of the lateral tibia (LT) green), that of the medial weight-bearing femoral condyles (cMF) yellow, that of the lateral weight-bearing femoral condyles (cLF) red, that of the patella (P) magenta, and that of the femoral trochlea (TrF) turquoise. Segmentation was performed based on a 3D-DESS knee imaging data set from the Osteoarthritis Initiative (OAI), a public-private partnership funded by the National Institutes of Health and conducted by the OAI Study Investigators. For anatomical (region of interest) labels, also see Figure 2 and Table 1.
