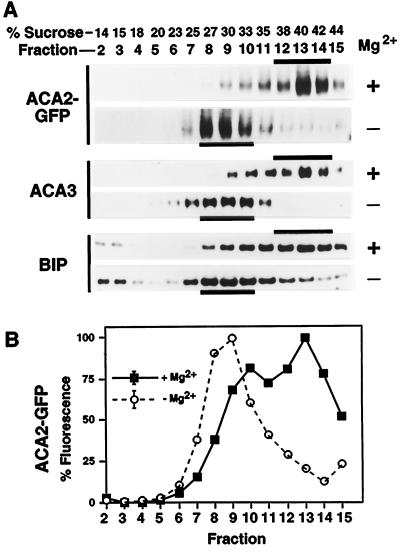
Figure 5.
Suc-gradient fractionation of membranes from 35S-ACA2-GFP transgenic plants showing cofractionation of ACA2-GFPp with ER markers. Microsomal membranes were fractionated through a 15% to 45% (w/w) Suc gradient and analyzed as described in Figure 2. A, Western-blot analysis of membrane fractions probed for ACA2-GFPp, ACA3p, and BIP. Western blots were probed with anti-GFP (1:2000) to specifically detect the ACA2-GFP fusion. ACA3p and BIP were detected as described in Figure 2. B, Fractionation profile of ACA2-GFP as detected by GFP fluorescence. Fluorescence was measured at 510 nm (±5 nm) with excitation at 480 nm. The values shown were derived by subtracting the background fluorescence detected in parallel gradients from a wild-type control (normalized per microgram of protein). Each point is the mean from the analysis of two gradients.

