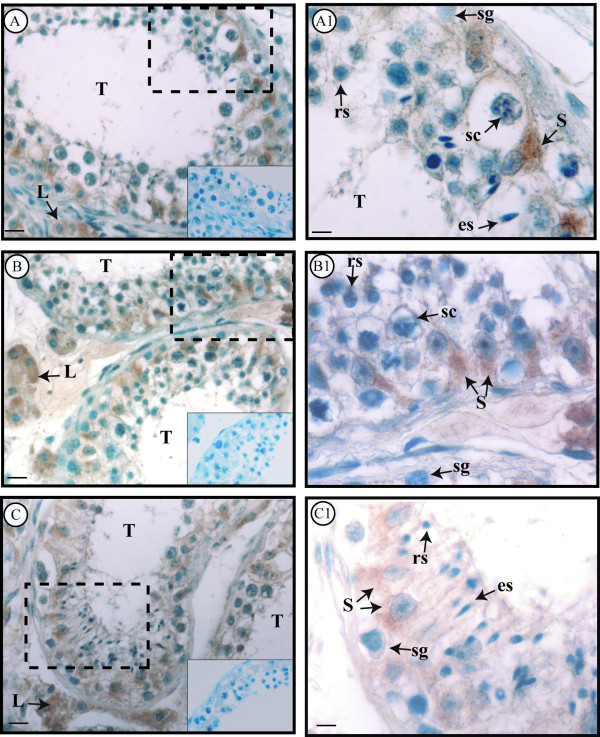
Figure 1.
Immunolocalization of GPER in control testes. A-C: Positive GPER immunoreactivity in the somatic cell cytoplasm of the three samples. A1-C1: Higher magnifications of testicular areas surrounded by the dashed lines in A-C. L, Leydig cell; T, seminiferous tubule; S, Sertoli cell; sg, spermatogonium; sc, spermatocyte; rs, round spermatid; es, elongated spermatid. Inserts: absorption controls. Scale bars = 12.5 μm (A, B, C), 5 μm (A1, B1,C1).

