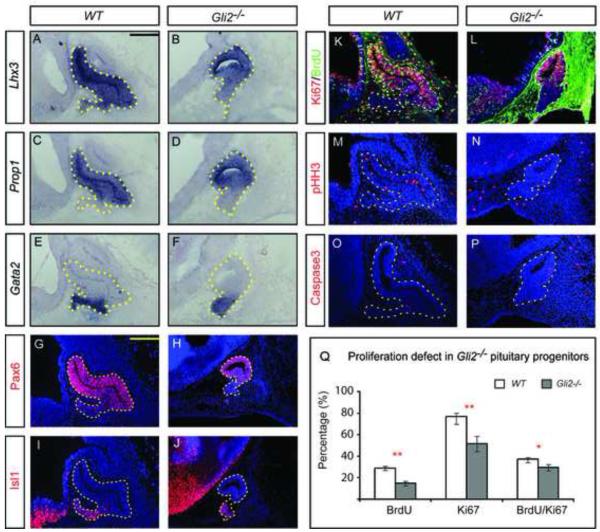
Figure 1.
Gli2 mutant pituitaries have normal patterning but show defects in proliferation. (A-F) RNA in situ hybridization of wild type (WT) and Gli2 mutants using probes of Lhx3, Prop1 and Gata2. (G-J) Immunostaining of Pax6 and Isl1. (K-P) Analysis of proliferation and cell death by immunostaining of Ki67, BrdU, pHH3 and Caspase3 in Rathke’s pouch. Note: The strong background staining in (L) is likely caused by leaky vasculature and elevated levels of mouse endogenous IgG in Gli2 mutants. (Q) Quantification BrdU incorporation, the expression of Ki67 and Caspase3. The percentage of BrdU+, Ki67+, pHH3+, Caspase3+ cells was calculated by dividing the number of the positive cells by the total number of nuclei (Hoechst). All embryos (n=6) were at E12.5. * indicates P<0.05, ** indicates P<0.01. Scale bars: 100 μm.

