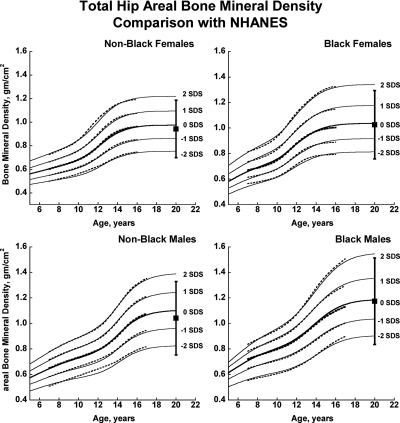
Fig. 1.
Reference curves for total hip aBMD for healthy male and female, Black, and non-Black children aged 5–20 yr. Shown are the curves for −2, −1, 0, +1, and +2 sd (Z-scores). Corresponding percentile distributions and L, M, and S values are shown in Supplemental Table 6. The dotted line curves are the previously published BMDCS reference curves (4) for ages 7 to 17 yr based on a subset of observations used to generate the final curves. The error bar to the right of each curve shows the young adult (20–29 yr) reference range (mean ± 2 sd) from the NHANES (12).

