
Figure 4.
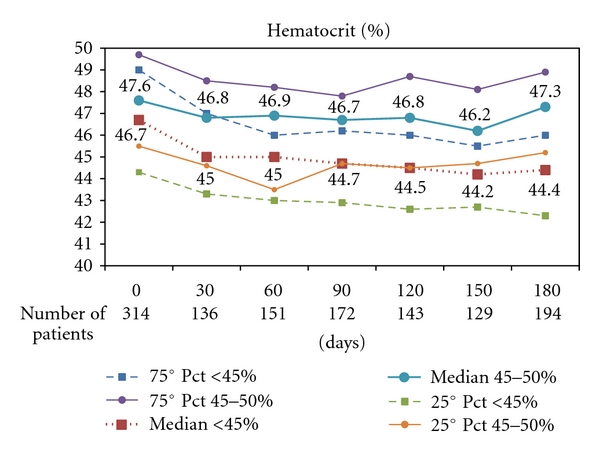
Distribution of Hematocrit (%) values at baseline and during 6 month Followup in each arm of CYTO-PV trial. The heavy dotted red line refers to the group of patients allocated to HCT < 45%; the heavy blue line refers to patients in the experimental arm (HCT 45%–50%).