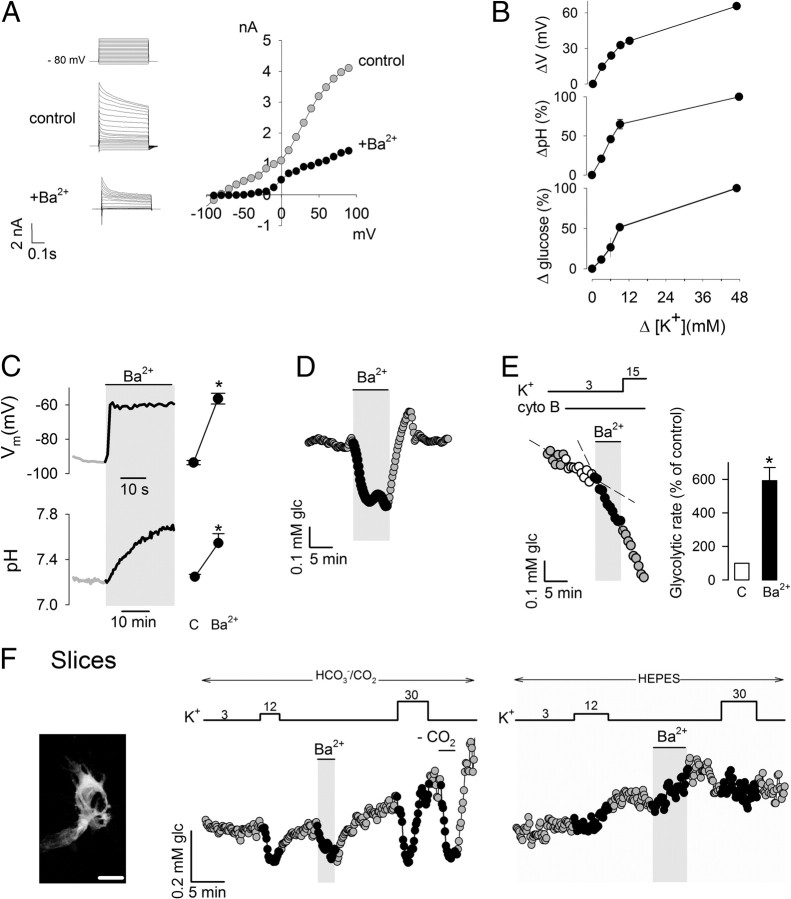
Figure 2.
Acute modulation of astrocytic glycolysis by membrane depolarization. A, The current/voltage relationship in cortical astrocytes was registered by patch clamping as described in Materials and Methods. Currents were recorded from a holding potential of −80 mV at variable 500 ms test pulses from −100 to +100 mV, in the absence and presence of 3 mm Ba2+. B, Effect of increasing K+ concentrations on membrane potential (n = 3 cells), pH (n = 3), and glucose concentration (n = 9 cells). Traces are representative of three independent experiments. Initial rates of pH increase and glucose decrease were estimated over 3 min. C, Membrane potential and intracellular pH was measured before and after exposure to 3 mm Ba2+. Bars summarize data from three experiments. D, Effect of 3 mm Ba2+ on intracellular glucose in a single astrocyte, representative of three similar experiments. E, Sequential effects of 3 mm Ba2+ and 15 mm K+ on the glycolytic rate of a single astrocyte. Bars summarize data from three experiments. F, Image on the left shows a 3D confocal reconstruction of two astrocytes expressing the glucose sensor FLII12Pglu600μΔ6 in an organotypical hippocampal slice. Bar represents 10 μm. Graphs illustrate experiments in slices testing the effects of 12 mm K+ and 3 mm Ba2+ on intracellular glucose in the presence and absence (HEPES) of HCO3−. Data are representative of three separate experiments.

