Figure 4.
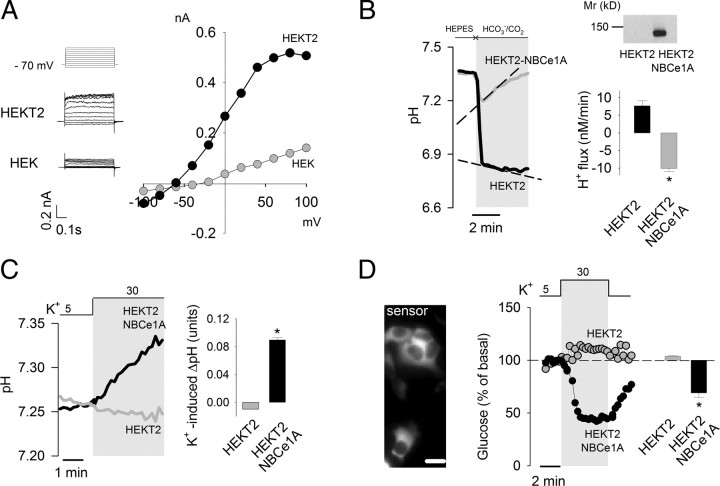
Assembly of K+-modulated glycolysis in HEK cells. A, The steady-state current/voltage relationship in HEK and HEKT2 cells was measured by patch clamp as described in Materials and Methods. The left panels show the actual currents recorded from a holding potential of −80 mV at different 500 ms test pulses from −100 to +100 mV. B, Protein expression in HEK and HEKT2 cells overexpressing NBCe1A was measured by Western blotting as described in Materials and Methods. NBCe1 activity was assessed by estimating the rate of acid extrusion in response to an acid load induced by switching from HEPES to HCO3−/CO2 in the presence of the NHE inhibitor amiloride (1 mm). The bar graph summarizes data from four experiments. C, The effect of K+ rise (from 5 to 30 mm) on intracellular pH was measured in HEKT2 and HEKT2-NBCe1A cells. The bar graph shows the change in pH after 3 min (n = 3). D, HEKT2 cells were cotransfected with cDNAs coding for the FRET glucose sensor and NBCe1A, bar represents 10 μm. The effect of K+ rise (from 5 to 30 mm) on intracellular glucose was measured in HEKT2 and HEKT2-NBCe1A cells. Bars show the change in glucose concentration after 3 min (n = 3).

