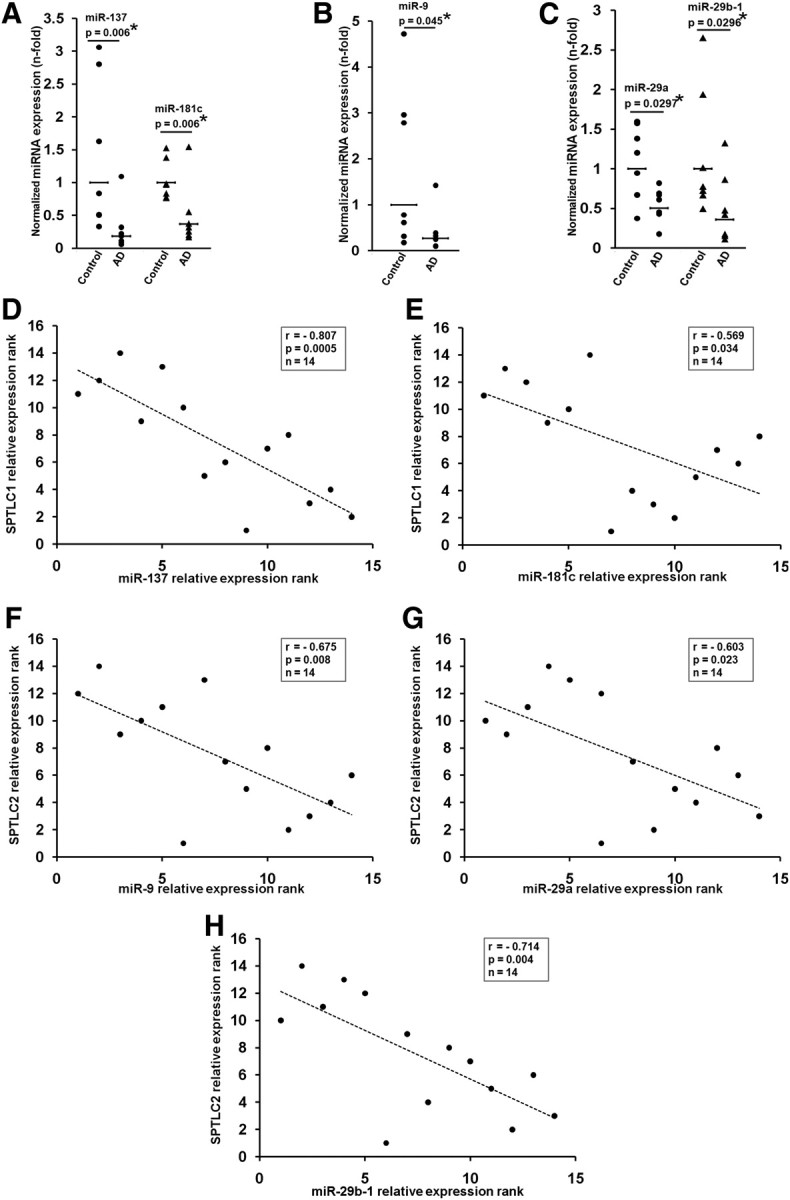
Figure 3.

Misregulation of miR-137, -181c, -9, and -29a/b-1 in AD brain. A–C, miR-137 and -181c (A), miR-9 (B), and miR-29a and -29b-1 (C) levels were quantified by qRT-PCR in controls (n = 7) and AD (n = 7) frontal brain cortices. Relative expressions shown are normalized to RNU6B and average control brain expressions. The statistical significance between control and AD brains were determined by two-tailed Student's t tests. D, E, Spearman's correlation test demonstrates significant negative correlation between miR-137, -181c, and SPTLC1 expression in the entire sample set (control and AD) (n = 14). F–H, Spearman's correlation test demonstrates significant negative correlation between miR-9, -29a, -29b-1, and SPTLC2 expression in the entire sample set (control and AD) (n = 14). The significance of the correlation was determined by two-tailed t distribution tests.
