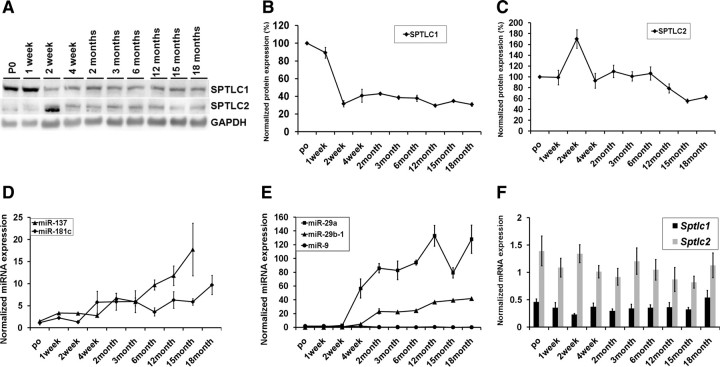
Figure 4.
Developmental coregulation of miR-137, -181c, -29a, and 29b-1, SPTLC1, and SPTLC2. A, Western blot analysis of SPTLC1 and SPTLC2 of P0 to 18-month-old mouse brain cortices (n = 3 for each age group). Gapdh was used as the loading control. B, Quantification of SPTLC1 expression from Western blots normalized to GAPDH and the average expressions represented as percentages of average P0 expression. C, Quantification of SPTLC2 expression from Western blots normalized to GAPDH (n = 3 for each age group) and the average expressions represented as percentages of average P0 expression. D, E, Relative expression levels of miR-137 and -181c (D) and miR-9, -29a, and -29b-1 (E) were measured by qRT-PCR in mouse brain cortices with RNU6B used as the normalizing control. F, Relative mRNA expression levels of Sptlc1 and Sptlc2 were measured by qRT-PCR with Gapdh as the normalizing control.

