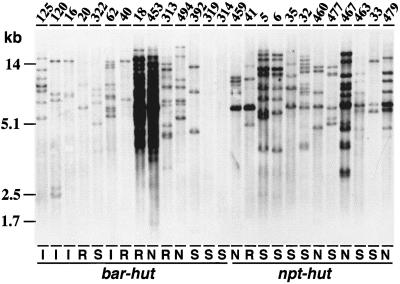
Figure 2.
DNA gel-blot analysis of CP transgene integration patterns and copy number in sugarcane transgenics. DNA gel blot of total DNA (10 μg) digested with HindIII and hybridized with a fluorescein-labeled 1.1-kb EcoRI fragment containing the SrMV-SCH CP and 3′UTR. Numbers above the lanes refer to individual sugarcane transgenics. I, R, and S denote immune, recovered, and susceptible plants, respectively; N refers to plants that were not inoculated and with an undetermined phenotype. Transgenics were selected on bialaphos (bar-hut) or on geneticin (npt-hut), as indicated. DNA size markers are shown on the left.

