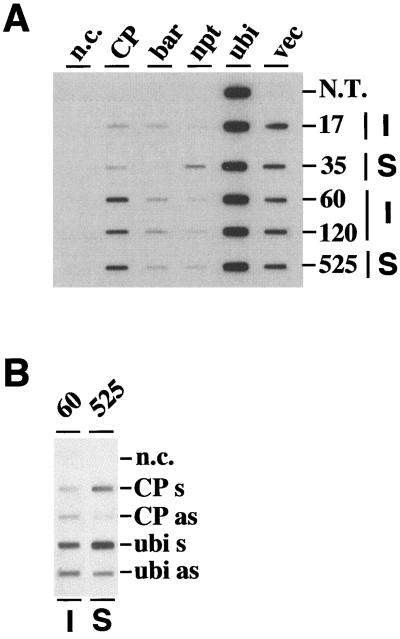
Figure 5.
Analyses of transcription rates for selected immune and susceptible transgenic sugarcane plants and a nontransgenic control. Nuclei were isolated from leaves of 1-year-old, field-grown plants and used in nuclear run-off assays. A, Autoradiogram showing 32P-labeled nRNAs hybridized to DNA fragments containing gene-specific sequences: CP, 1.1-kb coding sequence of the SrMV-SCH CP; bar, 0.58-kb coding sequence of the bar gene; npt, 0.76-kb 3′ part of the npt-coding sequence; ubi, 0.74-kb 5′ part of the SCUBI561 sugarcane polyubiquitin cDNA; vec, the 2.65-kb pUC8 sequences present downstream of the chimeric CP and marker genes; n.c., negative control (no DNA). Numbers on the right refer to plants used as a source of nuclei: 17, 60, and 120 are immune (I); 35 and 525 are susceptible (S) plants; N.T. is a nontransgenic, noninoculated control. B, Autoradiogram showing 32P-labeled nRNAs of the immune plant 60 and the susceptible plant 525 hybridized to in vitro-synthesized single-stranded RNA. Abbreviations are as in A. Sense (s) and antisense (as) refers to the polarity of the nascent RNA.

