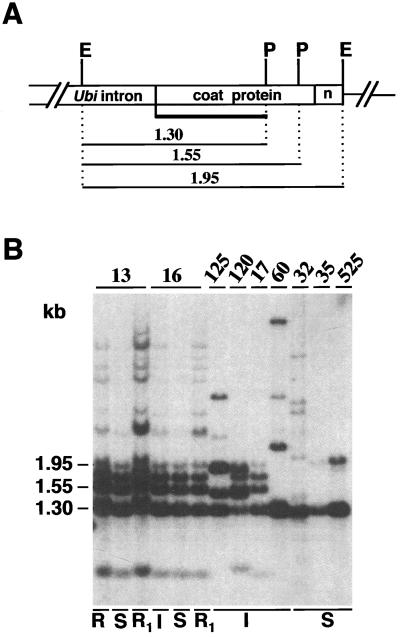
Figure 6.
DNA gel-blot analysis of differential methylation patterns in total DNA from resistant and susceptible leaf tissue. A, Diagram showing the position of the EcoRI (E) and PvuII (P) sites within the CP transgene. The solid line represents the 0.75-kb probe used for hybridization of the blot shown in B. The 1.30-kb fragment indicates complete digestion (no methylation) of the PvuII and EcoRI sites. The 1.55- and 1.95-kb fragments indicate partial digestion (partial methylation) of the PvuII site(s). B, DNA gel blot of total DNA (10 μg) digested with EcoRI and PvuII and hybridized with the probe shown in A. Numbers refer to sugarcane transgenics: 125, 120, 17, and 60 are immune (lane I); 32, 35 and 525 are susceptible (lane S). For plants 13 and 16: lanes S and R1 indicate symptomatic and resistant tissue harvested from the same plant before and after recovery; lanes R and I indicate resistant tissue from a different 13 and 16 clone that did not show symptoms upon re-inoculation. Hybridizing bands that correspond to the fragments shown in A are indicated on the left.

