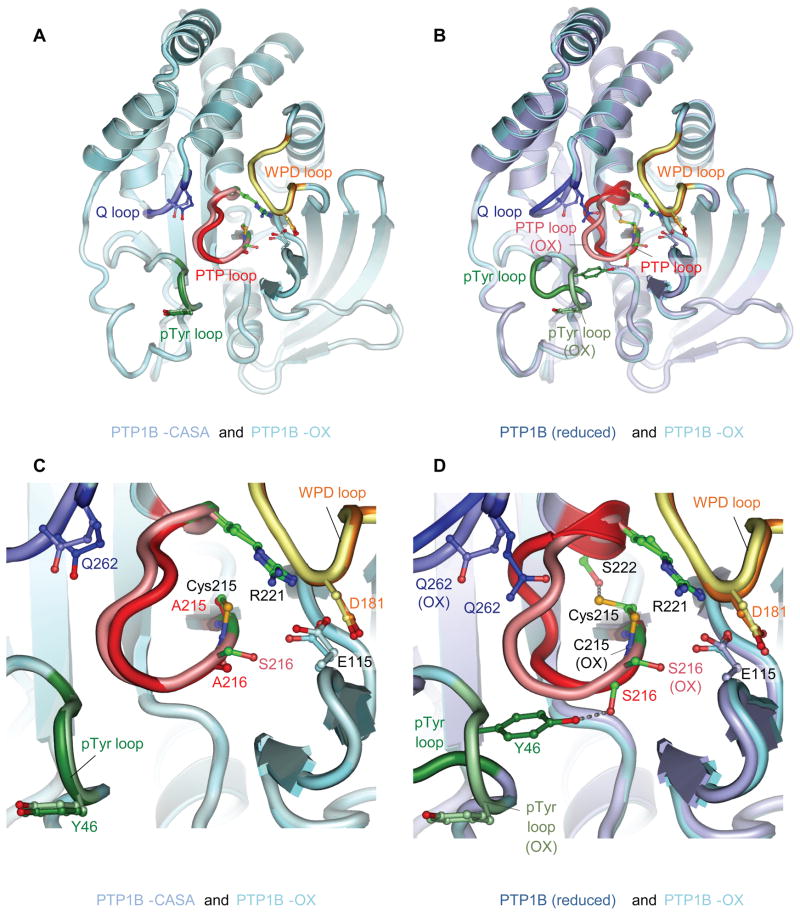
Figure 1. The Conformation of PTP1B-CASA Resembles that of PTP1B-OX.
(A) View of PTP1B-CASA superimposed onto PTP1B-OX (sulfenyl-amide species) (PDB code: 1OEM) (Salmeen et al., 2003). (B) View of PTP1B-CASA superimposed onto wild type reduced PTP1B (B) (PDB code: 2HNQ) (Barford et al., 1994a). In (A) and (B) the view is onto the catalytic site. (C) and (D) are the same superimpositions as (A) and (B) respectively, and show close-up views of the conformational changes at the catalytic site indicating that the PTP loop and Tyr46 of the pTyr loop become similarly solvent exposed in PTP1B-OX and PTP1B-CASA. In all figures the PTP loop, pTyr loop, WPD loop and Q loop of PTP1B-OX are shown as salmon, light green, yellow and light blue, respectively. The equivalent loops for PTP1B-CASA (A) and (C) and reduced PTP1B (B) and (D) are red, dark green, orange and blue. The Ca-Cb bond of Tyr46 of the reduced pTyr loop is obscured by the superimposition of the oxidized pTyr loop in Figure 1B and 1D. Crystallographic coordinates and structure factors of the PTP1B-CASA mutant have been deposited with the PDB with accession ID codes 3zv2 and r3zv2sf, respectively. Figures are produced using PyMOL.
See also Table S1.

