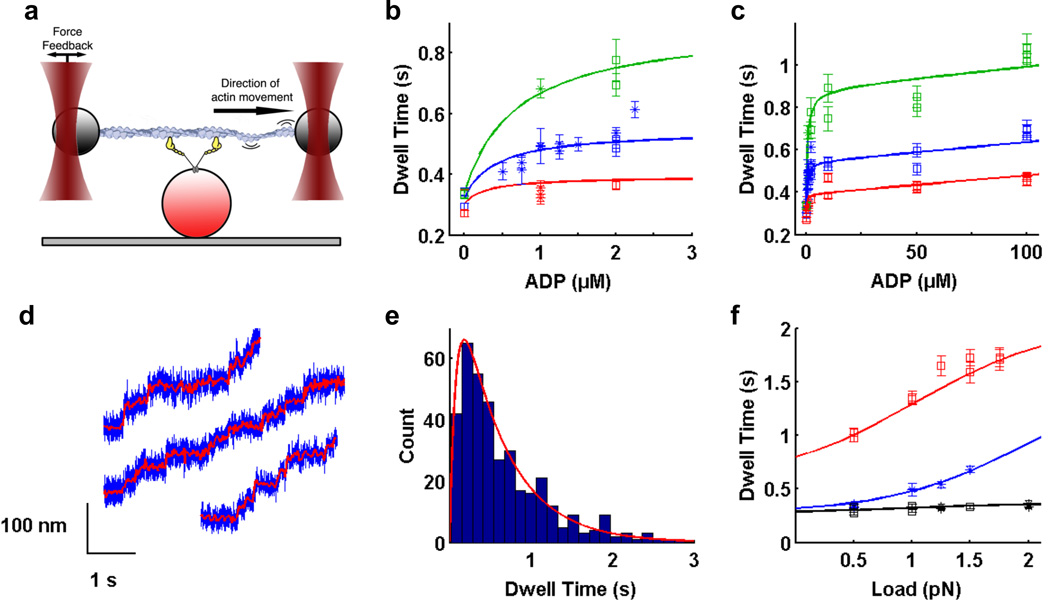
Figure 1. Optical trapping data and regression curves from kinetic model.
a) Optical trapping assay. Two polystyrene beads attached to ends of an actin filament are held in independently controlled optical traps. The actin filament is brought into contact with a surface platform bead-bound myosin VI molecule. Feedback control on one trap maintains the force applied on the myosin molecule as the motor walks along actin. b,c) Dependence of dwell time on b) low ADP concentrations up to 2.5 µM; c) ADP concentrations up to 100 µM, in the presence of 2 mM ATP (for zero ADP only) or 1.5 mM ATP and 0.5 pN (red), 1.0 pN (blue) and 1.5 pN (green) load. Within each condition, each data point represents a different myosin VI molecule. Squares are our measured dwell times, asterisks are data from ref. 6. Errors for dwell times were obtained by bootstrapping with 1000 replicates to get the standard error of the mean (SEM). d) Stepping traces of myosin VI in the optical trap in the presence of 1.5 mM ATP, 100 µM ADP and 1 pN load. Filtered bead positions (red traces) are overlaid on raw bead positions (blue traces). e) Dwell time histogram for one molecule under the same conditions as in d). Average dwell time is 0.69 ± 0.03 s. Red curve is the predicted dwell time distribution based on our model. f) Dependence of dwell time on load in the presence of 2 mM ATP (black), 1.5 mM ATP plus 1 µM ADP (blue), and 0.1 mM ATP (red). b,c,f) Best fit curves to dwell time data from global weighted least squares regression (solid lines). Refer to Supplemental Information for details of data analysis.

