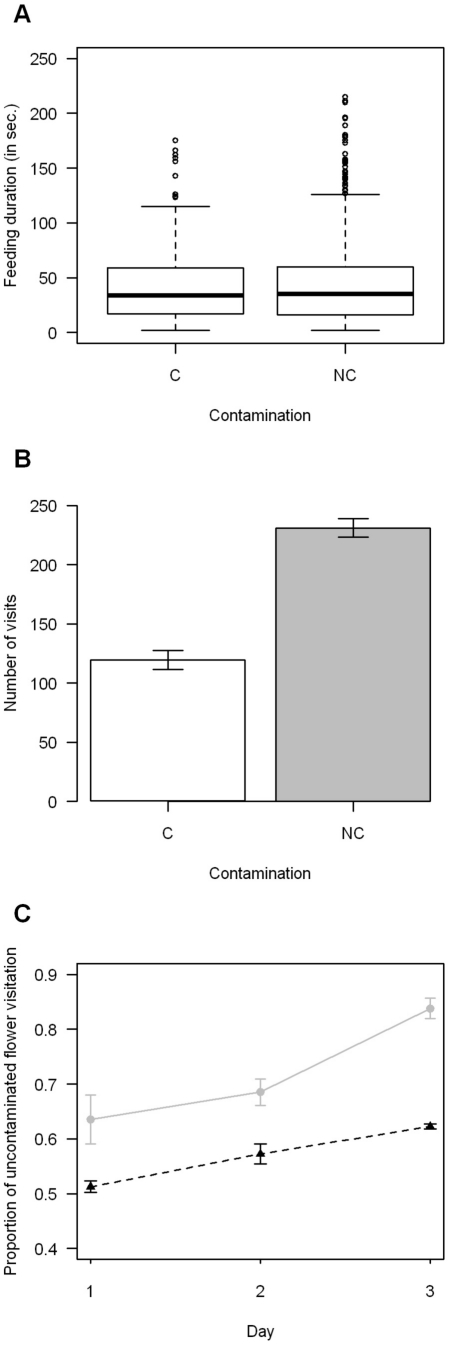
Figure 3. Feeding duration, flower preference and proportion of uncontaminated flower visitation for C. bombi experiment.
A) Feeding duration on both flowers with and without the presence of Escherichia coli (n = 1400), B) Visit duration on both flowers with and without the presence of Escherichia coli (n = 1400), C) Proportion of non-contaminated flower visitation over days and between sympatric population (grey dot & continuous line) and allopatric population (black triangle & dashed line) for C. bombi experiment. C (in white) represents the presence of the parasite in the flower and NC (in grey) its absence. For the feeding duration, box plots depict median, interquatile range and non-outlier range; the dots represent the outliers. The bars represent the means between the different colonies and their 95% confidence interval. Foragers spend the same time feeding on both flowers (GLMM: p = 0.24), visit preferentially the uncontaminated flower (GLMM: p<0.001). The proportion of uncontaminated flower visitation increase over days and for the sympatric population this increase is stronger than for the allopatric population (GLMM: p<0.01; factor day: p<0.05, interaction between day and population's origin: p<0.01).

