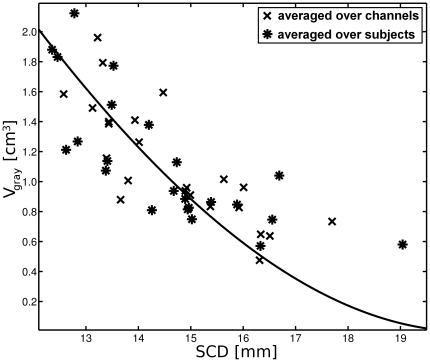
Figure 3. The relationship between scalp to cortex distance (SCD) and light absorbing gray matter volume .
 averaged over channels (crosses) or averaged over subjects (asterisks). In order to define a curve (continuous line) describing this relationship, we fit the depth parameter
  from the analytical expression for
  to the data, whereby
  is the percentage of light absorption beyond a certain depth according to figure 4. For
  the best fit (least square) of the ellipsoid is achieved, which corresponds to
  referred to as the relevant penetration depth
  .
.

