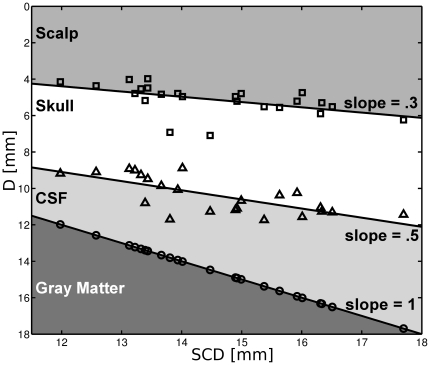
Figure 5. Scalp to skull distance (squares), scalp to CSF distance (triangles) and scalp to cortex distance (SCD, circles) are plotted against SCD to illustrate the proportional change of tissue types with increasing SCD.
The smallest increase of thickness is observed for the skull layer (slope  ), whereas the increase in CSF layer thickness with increasing SCD is twice as steep (slope
  ). Note, that the
  -axis is flipped, thus decreasing lines have positive slopes.

