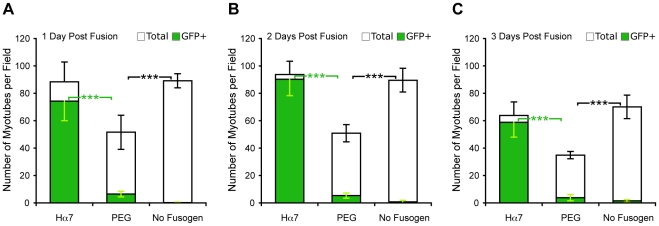
Figure 3. Comparison of Hα7 and PEG-mediated fusion efficiencies.
(A–C) The total number of myotubes (white bars) as well as the number of GFP-positive myotubes (green bars) was determined by visual inspection of randomly selected, low power (5x) fields at 1 day (A), 2 days (B) and 3 days (C) post-fusion. The number of GFP-positive myotubes observed following Hα7-mediated fusion was significantly higher on all days than the number observed following PEG-mediated fusion (green asterisks). The total number of myotubes surviving PEG treatment was significantly lower than the total number observed in co-cultures lacking any fusogen (black asterisks). ***: p<0.001 (unpaired t-test). Data are shown as mean ± s.d. of three independent fusion experiments.

