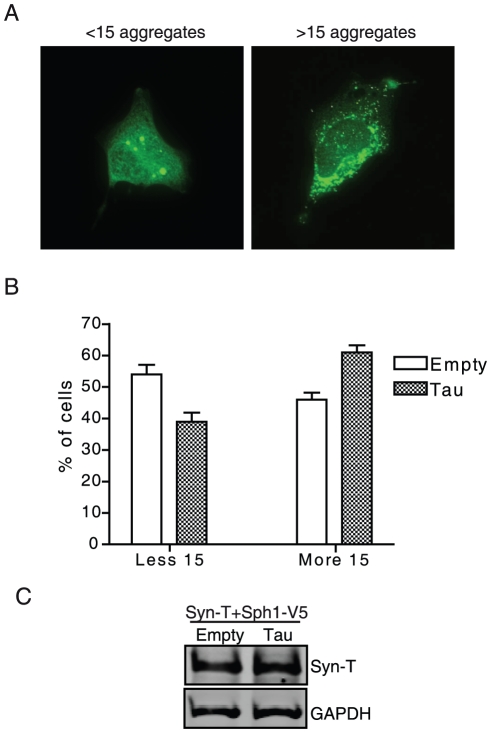
Figure 3. Overexpression of tau shifts the pattern of α-syn aggregation.
H4 cells were co-transfected with syn-T plus synphilin1-V5 and empty vector or tau. Co-transfection with tau in this model led to an increase in the number of inclusions and a reduction in their size. A, Cells were classified in two groups: cells with less than 15 aggregates and cells with more than 15 aggregates. B, Co-transfection of cells with tau increased the percentage of cells with >15 aggregates as compared with those transfected with empty vector (n = 250 cells). Results are mean ± SEM of 4 independent experiments. C, Total levels of syn-T were measured by western blot. GAPDH was used as a loading control. A representative experiment is shown (n = 4 independent experiments).

